
EVA - Good Enough for NASA
Table of Contents
Act I - The Set-Up


I have a task for Bob, our contractor programmer, to do. I estimate it’ll take him 40 hours to complete. He can start on Monday and be done by the end of the week. I’m not entirely stupid - so I know that this assumes there will be no disruption due to unrelated meetings, conflicting task priorities, design clarifications, hardware malfunctions, medical emergencies, car trouble, and the like.
Here is the plan:
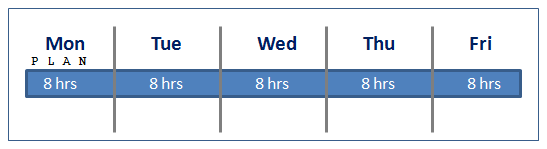
We pay Bob peanuts - to be precise, we pay him 20 peanuts per hour, which I will abbreviate to Pts20/hr.
So, last thing on Friday, I spend an hour with Bob going over the task, and tell him to have at it, starting on Monday morning.
Time passes.
It’s Wednesday evening and the last thing I do before I go home is stop by Bob’s cube to see how things are going. He’s also heading out for the day. Not surprisingly, he’s behind schedule - mainly because of an unrelated production issue that cropped up on Monday, occupying most of his day. He also had to pick up his daughter from school, so he was not able to stay late. But he started on Tuesday - and he came in early today, to get caught up - more or less.
I ask him what his estimate to complete is. He needs input from a couple of other people, so he needs some of their time. He may have to mix some other tasks in with this one, also. So, after some back and forth, here is what we end up with:
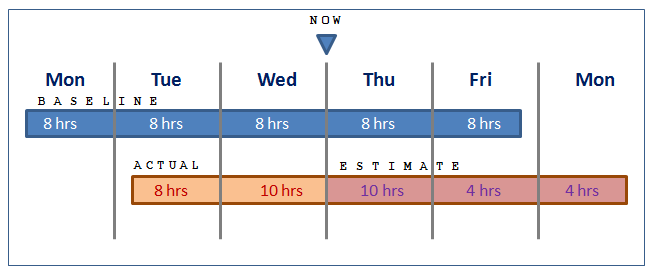
We have a baseline (the plan), plus the actual work completed so far, along with the estimated work effort remaining, spread out over elapsed time in what is (I hope) a realistic way.
Now, this is all somewhat simplistic. I haven’t tried to figure out if the 18 hours he’s spent so far are actually 18 constructive, relevant hours towards completing the task. But I’ll come back to this later.
At this point, I start to wonder about how to keep an eye on progress. It seems that the fundamental point here is to track variance - where we’re off course. So let’s start there.
Act II - Down to Work
Our baseline budget is: 40 hours of work effort, spread over a duration of 5 days, at a cost of Pts800. So we have work, duration and cost - from both the baseline and also the actuals and estimate.
According to the baseline budget we should be 60% complete in terms of both work effort and cost. That’s 24 hours of work, 3 days duration and Pts480.
As of Wednesday evening, we are actually here: 18 hours of work, 2 days duration and Pts360.
But wait! We started a day late! So we should also track that fact somewhere. And just to be pedantic, we should also recognize that our flat rate of Pts20/hr in this context is really nothing more than a way to convert work effort into money. But somehow, money gets the attention of Senior Management in a way that hours do not - so maybe there is some utility in keeping it. In fact, let’s express everything we can in terms of our nutty currency.
Here is a table showing where we are:
|
|
We’ve decided that negative values represent a good thing (early, under budget, etc) whereas positive values represent a bad thing (late, over budget, etc).
I also slipped in a new statistic - Estimate At Completion (EAC), which I chose to measure in hours in this case. This allows me to add yet another statistic - the Percentage Complete. Bob should be 60% done by now, but he’s only half finished.
Looking at the above table, we can create some fancy-sounding titles for some of these numbers:
|
|
The above two statistics are based on work efforts, not durations, of course. We can also go one step further:
Budgeted Cost of Work Performed (BCWP) = 50% * Pts800 = Pts400
BCWP is also called Earned Value (EV) and shows us the proportion of the work which has actually been performed.
Act III - Time Changes Everything
Now we can track these metrics over time - and see how they change. In fact what we now have is a set of quantifiable measurements which can be folded into a formal discipline:
Earned Value Management.
NASA, for example, has a lot of info you can read about this discipline.
The fundamental question is: What are we getting for the money we’re spending?
And, based on that, we can start making informed, objective decisions about the direction our project is taking.
Act IV - What Happened Next?
I once tried to introduce EVA into a small I.T. consulting company I used to work for. I built an Excel template for people to enter their weekly actuals, and revised estimates for task completion. I gave presentations on EVA to my colleagues. It was a very basic version of what EVA can be - pretty much just what I describe above.
The discipline didn’t stick, however.
A few years later, I worked on a team that was trying to use Scrum for managing work and backlogs. Our story estimation was in “tee-shirt sizes” - about as far removed from something like EVA as I can imagine.
That technique stuck - more or less - but was a constant source of uneasiness for everyone involved.
At least we weren’t trying to put a man on the moon.